Calculation of a circular BHE field in Madrid, with curved boreholes
Note
The example is located in the following
working directory: geoloop/examples/bore_field/madrid
This example demonstrates how to simulate BHEs with a curved trajectory, in agreement with the case presented in Wawoe et al. (2025). The concept of the bore field is similar as described in the example about a BHE field in the middle east, but incorporates a depth-variable tilt in a circular borehole field. This is defined in the BHE field configuration JSON (as explained in the Manual), of the main simulation module.
In addition, in using the pre-defined load profile, the flow rate is scaled such that the ratio of the required pumping power
to the generated power (or the COP of the fluid circulation pump) is constant. See the Manual for an explanation
of the configuration of Loadprofile the module.
The bore field consists of 9 boreholes with a borehole length of 694 m and a borehole diameter of 0.15 m. The boreholes are arranged in a circle with a radius of 20 m, and curve upwards with a tilt of 70 degrees deviation from the vertical at the bottom of the BHE. The boreholes are equiped with parallel double U-tubes, deploying water as working fluid.
The bore field is simulated for a period of 25 years with a time step of 24 hours.
Running the example
For running the example, either run the batch script batch_madrid.py directly from your
IDE or use the CLI by:
Results
In the Loadprofile module, the heating and cooling demand is loaded from a csv file loadprofile_madrid_groundload.csv in
the input directory of the example.
The resulting load is displayed as a figure in loadprofile_madrid_groundload.png in the output directory of the example.
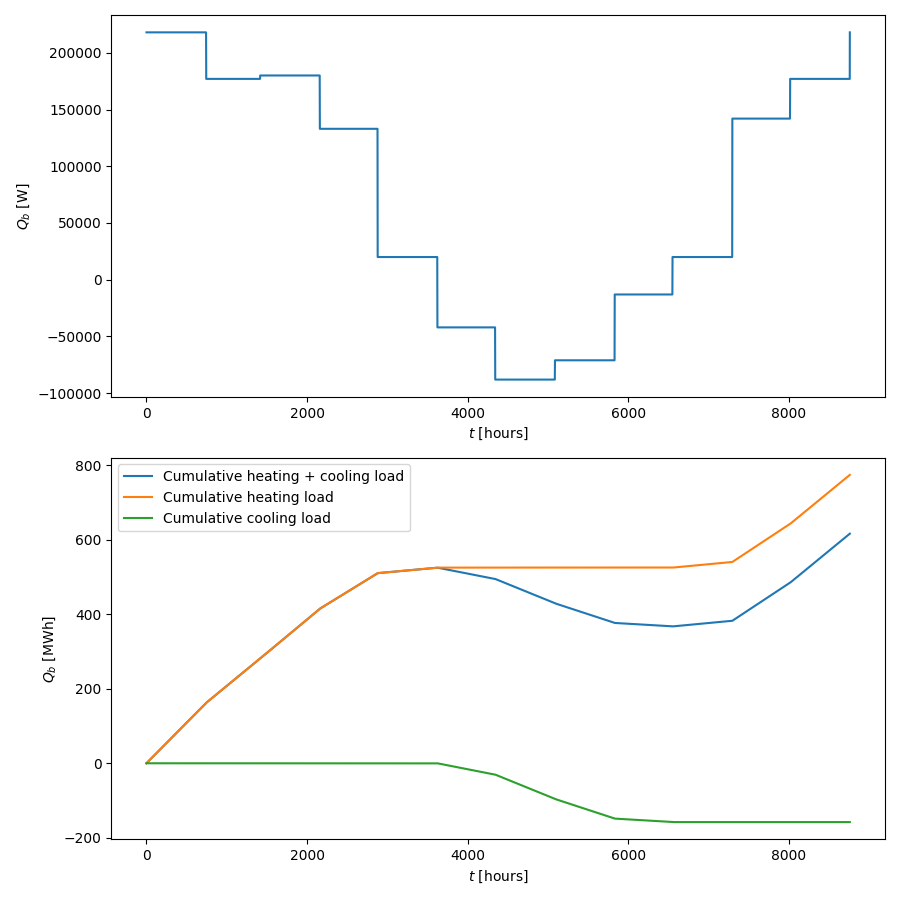
Fig. 1: Heating and cooling demand imposed on the curved borehole field in Madrid (cooling is negative).
The simulation results are stored in the directory output/madrid_su_round_curved and contain the bore field geometry and borehole tubing layout as output from
SingleRunSim
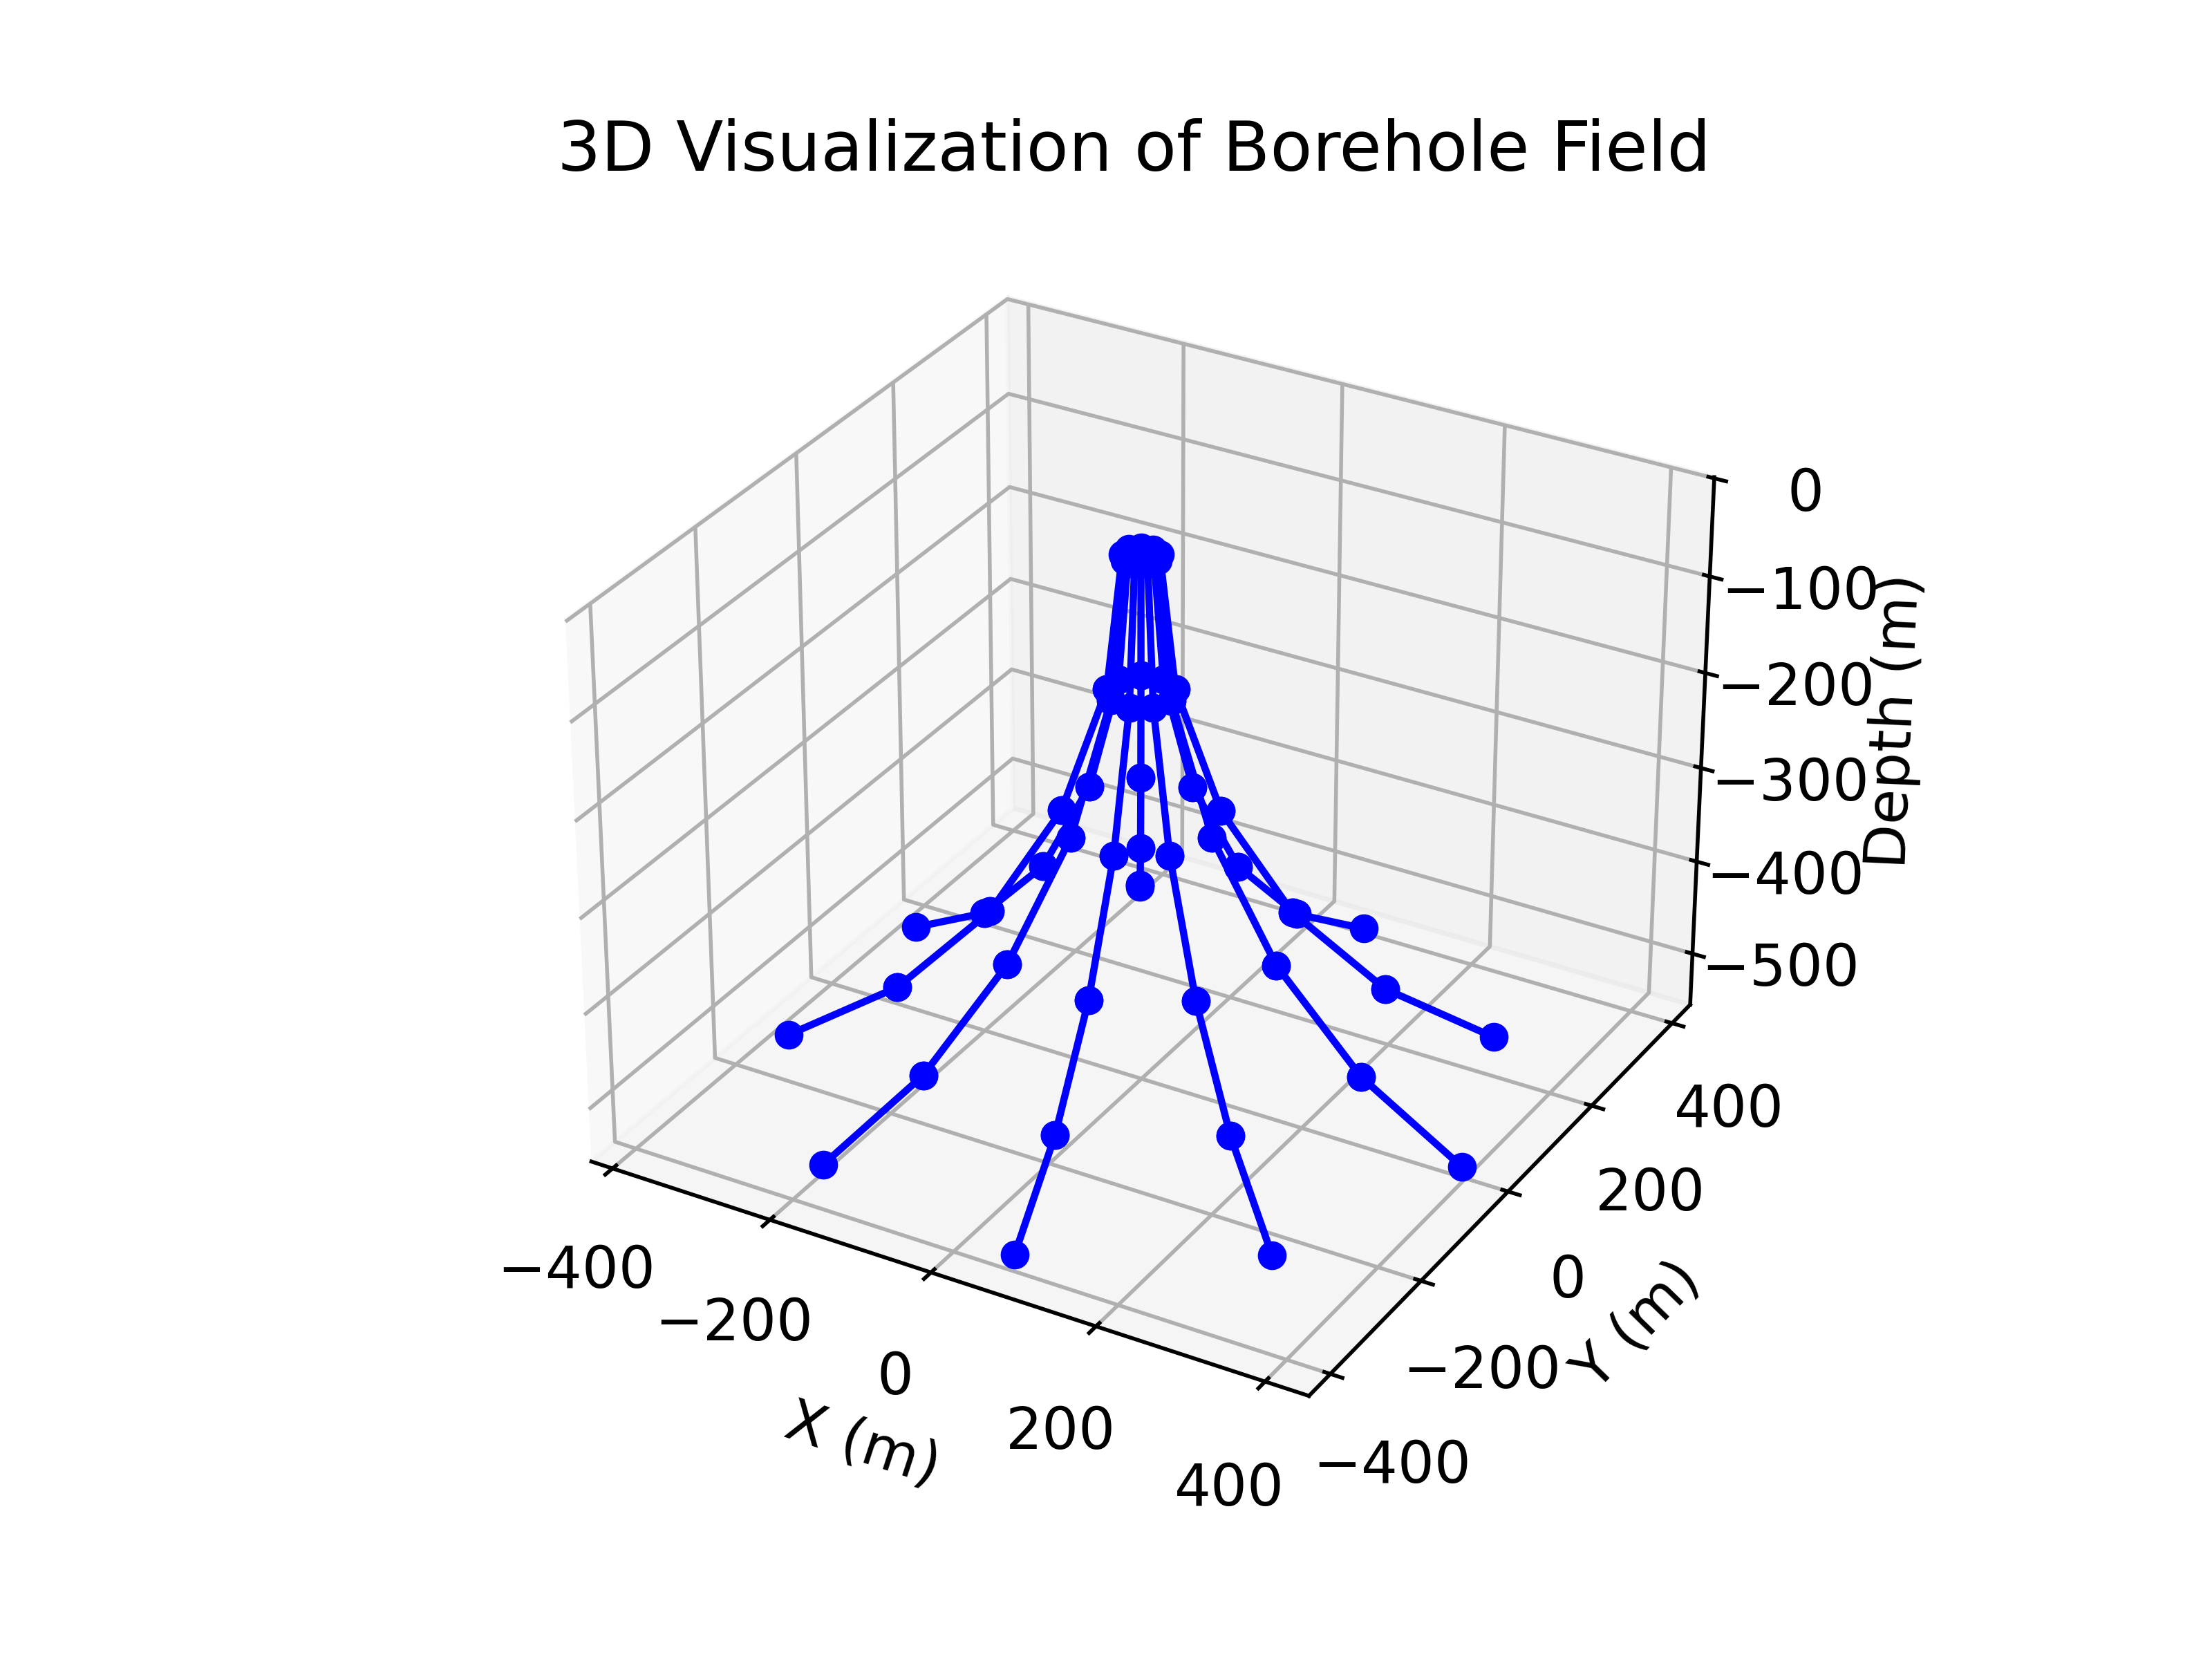
Fig. 2: Layout of the circular borehole field with tilted boreholes Madrid.
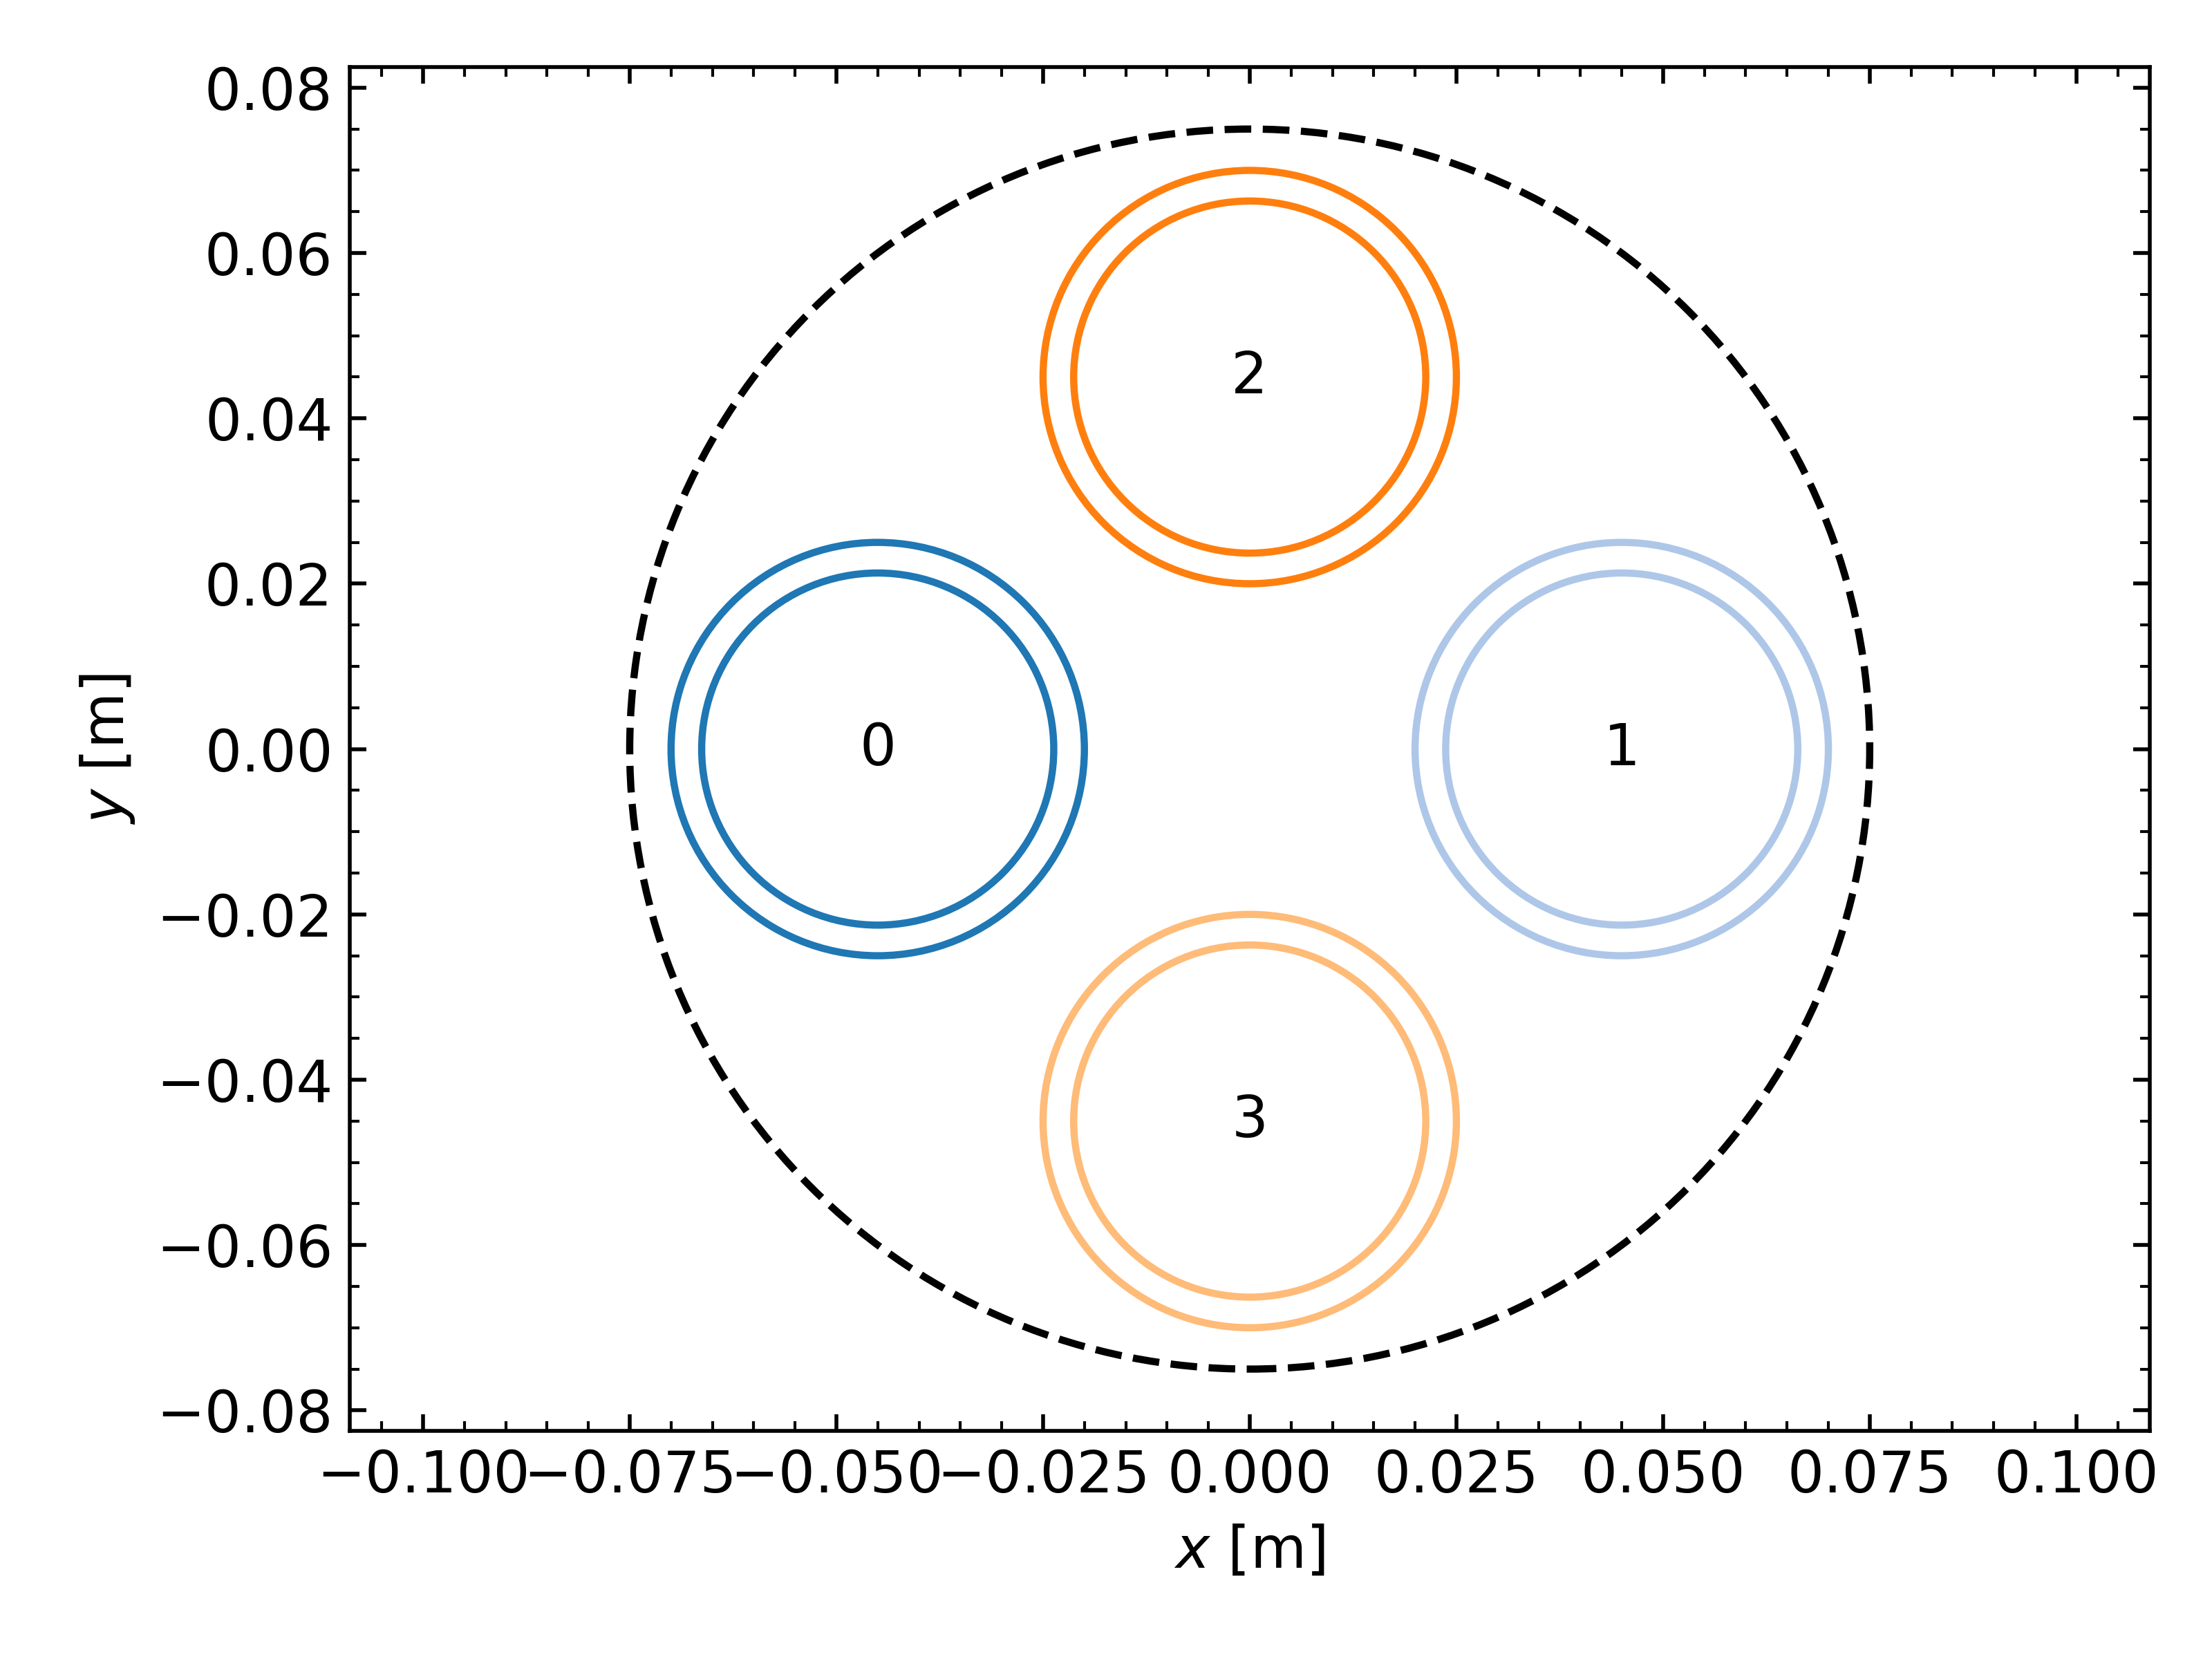
Fig. 3: Design of the double U-tubes in the boreholes in Madrid.
Other results have been visualized by running the Plotmain command:
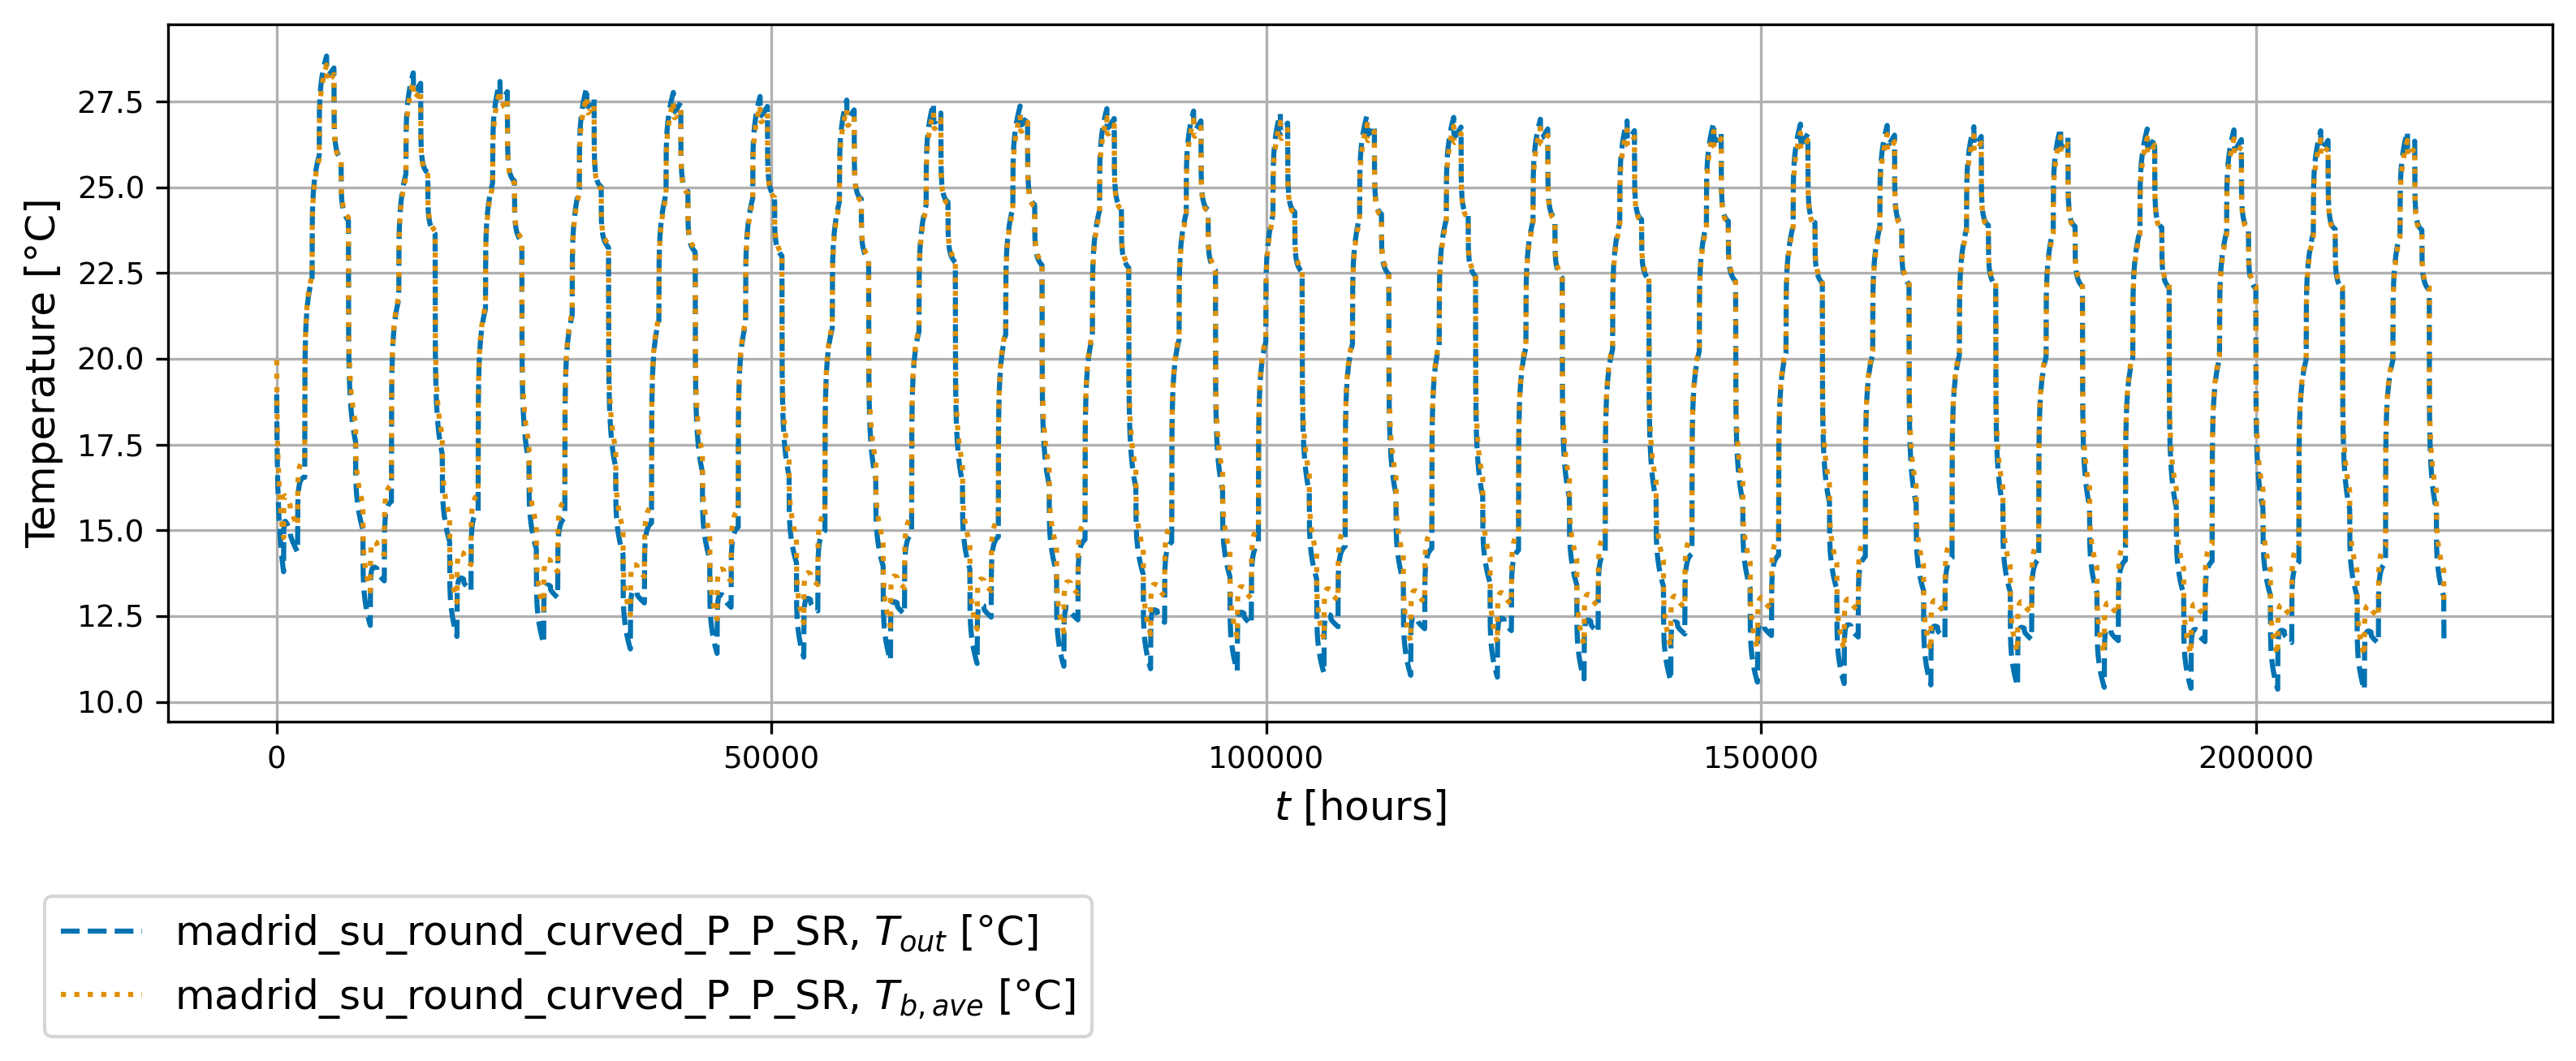
Fig. 4: Timeseries plot of the circular borehole field with tilted boreholes; average borehole wall temperature and outlet temperature.
References
- Wawoe, D., Badenes, B., Blangé, J.J.,Creyghton, M., Godschalk,B., Ibanez, S.E., Goitia, Y., Rus, B, Martinez Zuazo, I., Van Wees, J.D.: A Semi-Analytical Model of the Energy Output of Curved Borehole Heat Exchangers, in: proceedings of European Geothermal Congress, Zurich, https://europeangeothermalcongress.eu/wp-content/uploads/2025/11/Wawoe-et-al.pdf, 2025